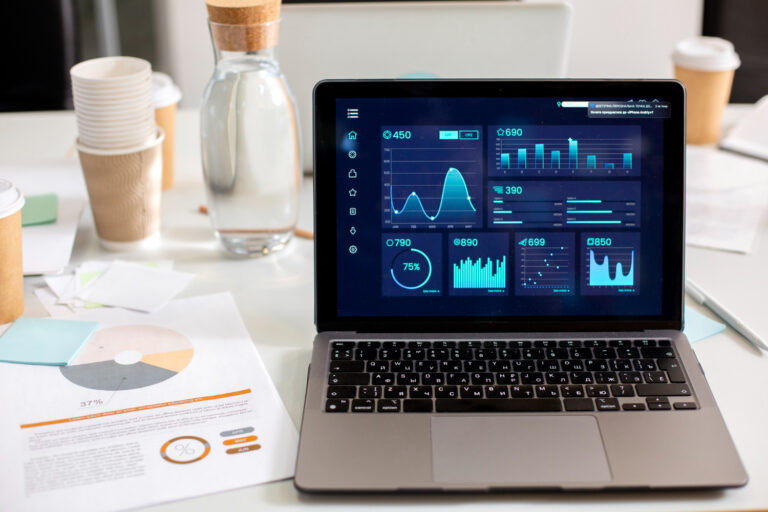
Data Analytics
Data analytics is the field that helps firms identify their areas of strength and weakness. Organizations are empowered to reach the correct audience by estimating rather than speculating. Understanding the preferences and needs of customers can help streamline corporate activities and improve the outcomes of those activities. With this previously unknown information now revealed, the businesses gain an advantage over rivals and is better able to produce outcomes that are accurate and satisfy customers.

Data Analytics Services We Offer

Financial analytics
1. Monitoring revenue, expenses and profitability of a company.
2. Profitability analysis and financial performance management.
3. Budget planning, formulating long-term business plans.
4. Financial risk forecasting and management.

Sales and product analytics
1. Sales channel analytics.
2. Pricing analytics to design pricing strategies.
3. Identifying and predicting sales trends.
4. Tracking customer interactions with a product to identify pain points leading to churn.

Retail analytics
1. Retail business performance analysis, monitoring sales and profitability.
2. Demand analysis and forecasting.
3. Multi-echelon inventory optimization.
4. Assortment and merchandising planning and optimization.

Data management services
ScienceSoft implements a robust data management framework to organize your processes of data collection, storage, access, security, analysis, etc. and optimization.
Our Process
Process of Data Analytics
Building an infrastructure for data aggregation, analysis, and reporting is what data analytics entails. Pearlinfo , a seasoned provider of data analytics services, provides complicated and simple business analytics solutions.
Once your goal has been determined, you must come up with a plan for gathering and combining the necessary data. Choosing the data you require is a crucial component of this. This could be qualitative (descriptive) data, like customer reviews, or quantitative (numeric) data, like sales figures. First-party data, second-party data, and third-party data are the three categories into which all data falls. Explore each one separately.
Now that all of your data is in one location, it is crucial to clean the data before starting this procedure’ analysis phase. Making sure the data is in a format that can be used is a big component of the cleansing process. This comprises looking for data that might have been entered erroneously, dealing with null values, and looking for outliers. This can frequently be a protracted and difficult procedure. According to a recent poll of data scientists, data analysts spend about 27% of their time cleaning up data (2). Data purification is essential to maximising the accuracy of your research, even while it may not be the most glamorous or fun step in the process of data analysis.
It’s time to conduct an analysis once the pertinent data has been collected and cleaned. The question or aims that were previously stated and the sort of analysis required will play a significant role in the technique of analysis selection. Data is used in diagnostic analysis to identify a problem’s root cause and potential solutions. By summarising the most important sections, descriptive analysis can characterise the data. Predictive analysis uses both historical data and statistical modelling to make future performance predictions for certain indicators. For instance, you could use predictive analysis to examine historical data to estimate how sales will change by fiscal quarter in the following year. Afterwards, you may extrapolate the patterns seen to estimate the sales for the following year. In these
Interpreting the findings after data analysis is crucial. In other words, what are you taking away from the findings of your analysis? The results can be interpreted in one way by using data visualisations. This can be carried out using coding tools like Matplolib or Plotly. But, a variety of BI Tools are also accessible, allowing users to see data in a variety of ways. These tools are excellent at enabling users to produce visualisations as a means of informing stakeholders, clients, and internal executives about important metrics and trends. To find out more about the benefits and effects of each visualisation type, read one of our earlier blog posts on selecting the appropriate visualisation. Users can tell a story by combining various graphics in a single report.
Process of Data Analytics
Building an infrastructure for data aggregation, analysis, and reporting is what data analytics entails. Pearlinfo , a seasoned provider of data analytics services, provides complicated and simple business analytics solutions.

COLLECT DATA

DATA WRANGLING

DETERMINE ANALYSIS

INTERPRET RESULTS
Frequently Asked Questions
The ability to gather enormous, complex data sets that can be managed, mined, and analysed to deliver real-time insights and forecasts through the provision of data analytics has been made feasible by advancements in Microsoft Big Data solutions technology, including SQL with R integration.
Absolutely, for the most part.
Most of the businesses we work with began their analytics journeys by building a dashboard using Microsoft Power BI, along with some visualisations and correlation plots. This will enable stakeholders to comprehend the data collected and identify any gaps that need to be filled.
Additionally, it offers a strong platform for advancing to predictive analytics.
A data-driven culture, data, space to experiment and grow, and a clear understanding of your goals are all necessary.
Data analytics calls for a far more thorough method of gathering, analysing, and dissecting data, as well as the presentation of the results in an understandable visual style.
Unfortunately, the solution to this issue is not straightforward.
The most crucial resource for every analytics endeavour is data. Organizations must therefore collect as much organised business, transactional, and customer data as possible.
We’ve discovered that a data discovery workshop is effective in helping you understand the volume and quality of the data you currently have, where it is kept,

Why Choose Pearlinfo For Data Analytics

Highly Creative & Motivated Teams

Continuously Evolving & Growth-Focused Teams

Your Ideas Are Safe With Us

Timely Solutions
